Introduction
Characterizing radiant sources like laser diodes accurately depends on the ability to measure their optical power output accurately. A number of vital device characteristics can be extrapolated from these optical power measurements, including maximum output power, threshold current, and kink test/slope efficiency. Measuring optical power accurately requires capturing a known fraction of the emitted energy from the source. Inconsistent radiation collection or inaccurate measurements can cause an acceptable device to be graded incorrectly or rejected, reducing the manufacturing yield. This white paperoffers an overview on using an integrating sphere to measure the optical power of radiant sources in a production environment
Elements and Methods
In a production environment, test system speed and accuracy are critical. Although thermal detectors or vacuum tubes can make accurate optical power measurements, the slow speed and relatively large size of these devices make them less than ideal for a production setting. Positive-doped layer, intrinsic layer, negative-doped layer (P-I-N) photodetectors provide both the accuracy and the speed that production testing demands; they're also small in size and easily biased with low voltage sources. They're available in many configurations, so the detector can be tailored to the needs of the test.
P-I-N photodiodes offer two methods for measuring optical power:
- Direct coupling of the emitted radiation to the photodetector.
- Coupling to the detector through an integrating sphere
Direct Coupling Method

In the direct coupling method, the emitted radiation falls directly onto the detector and creates a current in the detector, as shown in Figure 1. This photocurrent can then be read using instrumentation capable of measuring low levels of current. If the detector is designed properly, this can be a very straightforward current measurement. However, making accurate optical power measurements requires addressing a number of system design details.
-
Underfill and overfill: Optical sources such as laser diodes can have non-circular (astigmatic) beam profiles. When an astigmatic beam profile meets the plane of a photodetector, a portion of the detector is not exposed to the source light (Figure 2a). A portion of the astigmatic source may also spill over the edge ofthe detector, so it would not be included in the measurement. Figure 2adepicts overfilling the detector. In this case, the beam diameter exceeds the detector diameter. As a result, a portion of the optical source output does not contribute to the measured photocurrent. While using a larger detector may seem like an obvious solution to this problem, larger detectors exhibit more electrical noise and higher capacitance than smaller ones, slowing measurement speed.

Figure 2a. Underfill. Figure 2b. Overfill. -
Beam alignment: Even when the source beam is the same size or smaller than the detector, beam alignment is critical to ensuring power measurement accuracy. Aligning the beam is more difficult when the optical source is at a wavelength outside thevisible spectrum, such as the wavelengths used in fiberoptic telecommunications

Figure 3. Beam misalignment - Polarization: The germanium (Ge), silicon (Si), and indium gallium arsenide (InGaAs) crystals of which detectors are manufactured have a variety of lattice orientations. As a result, they may be sensitive to the polarization of the incident radiation. Optical measurement accuracy may be affected when measuring polarized sources, such as Distributed Feed Back (DFB) lasers and Vertical Cavity Surface Emitting Lasers (VCSELs). Loss due to polarization effects is known as polarization dependent loss (PDL).
- Saturation: At power levels greater than the photodetector's maximum power limit, the relationship between the incident optical power on the detector and the detector photo current output becomes nonlinear. This nonlinearity degrades the accuracy of the measurement. Typically, detector saturation occurs when total optical power reaches a few milliwatts. Neutral density filters, calibrated optical attenuators, or power splitters can be used for power levels greater than a few milliwatts, but the additional uncertainty of the attenuating device must be added to the final accuracy calculation.
- Back reflection: Although many detectors have AR (anti-reflective) coatings, back reflections can still be generated from a detector surface or the detector window. If the optical source to be measured is dependent on an optically resonant cavity (laser source), it's critical to prevent back reflections from entering the cavity because they can disrupt the stability of the source. The detector can be tilted a few degrees to prevent back reflections from entering the source, but if the tilt is excessive, the detector window may act to polarize the light, leadingtoPDL.
Coupling to the Detector through an Integrating Sphere
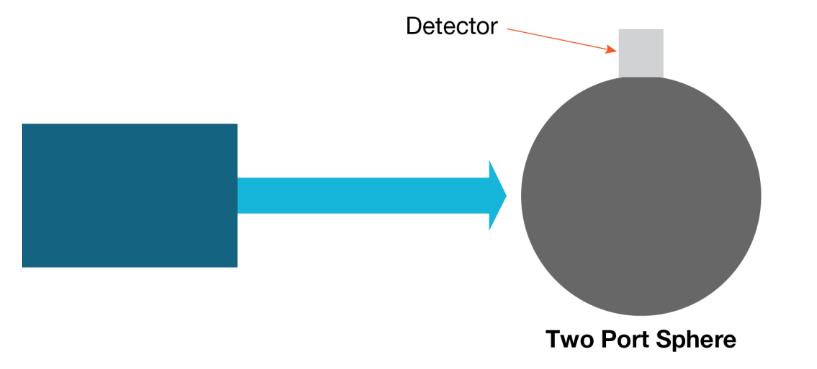
The preferred method of coupling the radiant source to the detector employs an integrating sphere and detector connected to an optical power meter or electrometer. (See the section titled Electrometers and Optical Power Metersfor further details.) An integrating sphere is essentially a spherical cavity with a diffuse reflective interior surface that's designed to distribute the optical power from a radiant source uniformly over its interior.

To illustrate the function of the integrating sphere, let's follow a ray of light as it travels through the sphere. The light enters the sphere through an entrance port and strikes the concave spherical surface at a point opposite the port. This point of incidence is known as the first strike area. This light ray is reflected diffusely, scattering the initial beam of light in many directions. Then, the diffusely scattered rays undergo multiple reflections until the intensity of the interior of the sphere is uniform (except for the first strike area). A detector placed on the interior surface of the sphere (excluding the first strike area) receives uniform irradiance and the fraction of the total energy entering the sphere and measured by the detector is determined empirically. As a result, the optical power at that point can be measured
The use of an integrating sphere largely eliminates the errors encountered in the direct measurement method because:
- The cross-sectional beam profile of the source is not an issue if the sphere's entrance port is large enough to capture the entire beam width. The reflective material of the inner surface of the sphere provides a diffuse and highly reflective surface. All these diffuse reflections scatter the initial beam and the energy is uniformly distributed over the interior surface of the sphere.
- Beam alignment is not critical if the entire width of the beam enters the input port of the integrating sphere. Light entering the sphere is uniformly distributed on the interior surface of the sphere. As a result, the surface of the detector will receive uniform radiation at any locations. To obtain an accurate measurement, baffles may be necessary to shield the detector from direct, nonscattered radiation.
- Polarization effects are mitigated because the multiple diffuse reflections randomize polarization
- Integrating spheres attenuate the incident radiation. The integrating sphere uniformly distributes the energy of the incident beam over a larger surface area than the original beam profile. As a result, a small amount of the initial beam power is incident on the detector and sensitive detectors may be used to measure high-powered sources. In fact, optical powers up to several kilowatts have been measured using specially designed integrating spheres.
- Back reflections are minimized. Only a very small fraction of the light that enters the integration sphere is reflected back out the entrance port at an angle that retraces the angle of the entrance beam. Should this small amount of light enter the resonant optical cavity, the effects on the source stability will be minimized.
- The integrating sphere can accommodate very high angles of beam, provided the optical source is located very close to the input port. For instance, an edge-emitting laser diode chip may have a beam divergence of 70°. By placing the chip within a few millimeters of the input port, an accurate power measurement can be made.
- Internal Reflectance - For accurate measurements, it is critical for the internal surface of the sphere to be highly reflective at the wavelength of light to be measured. Traditionally, integrating spheres are constructed using two hollow hemispheres. The interior is coated with a material that is reflective at the wavelength of interest and diffuses the input light. Spheres utilizing this type of coating are sensitive to environmental changes (humidity, atmospheric conditions: acids, bases, and vacuum). To maintain a high level of accuracy, many manufacturers suggest recoating once a year.

Figure 5. Anatomy of an integrating sphere - Sphere Diameter - The inner diameter of the sphere (or, more directly, the inner surface area of the sphere) relative to the area of the input and detector ports largely defines the “cosine” performance of the integrating sphere. The sphere's "cosine" performance indicates how much the angle of the input light affects the accuracy of the sphere.
- Input Port - The input port is the opening through which light enters the integrating sphere. The diameter of the input port is kept to a minimum to reduce its effect on the performance of the integrating sphere. The optical characteristics of the source affect the physical properties of the sphere. To ensure all the energy is transmitted through the entrance port of the sphere, the port diameter must include the divergence angle of the source
- Detector Port - The detector port is where the photodetector is mounted. As with the input port, the detector port is also kept as small as possible to minimize the effect on performance.
- Port Adapter - The port adapter is the mechanical hardware that links the input device with the input port of the integrating sphere. The types of port adapters available include fiber connector adapters (FC/PC, SMA, etc.) and bare fiber adapters. For sources with a high divergence angle, such as bar and chip lasers, no port adapter is needed.
Detector and Sphere Considerations
The characteristics of a specific sphere and detector are unique to the degree that they must be calibrated as a set. Once calibrated, this detector/sphere pair must remain together to maintain the accuracy of the calibration. Separating the detector from the sphere or changing the angular orientation of the detector by rotating it will change the calibrated response of the sphere/detector pair.
To obtain the maximum performance from a detector and integrating sphere combination, the source wavelength, optical coupling (fiber connector, air gap, etc.), and maximum power must be know.
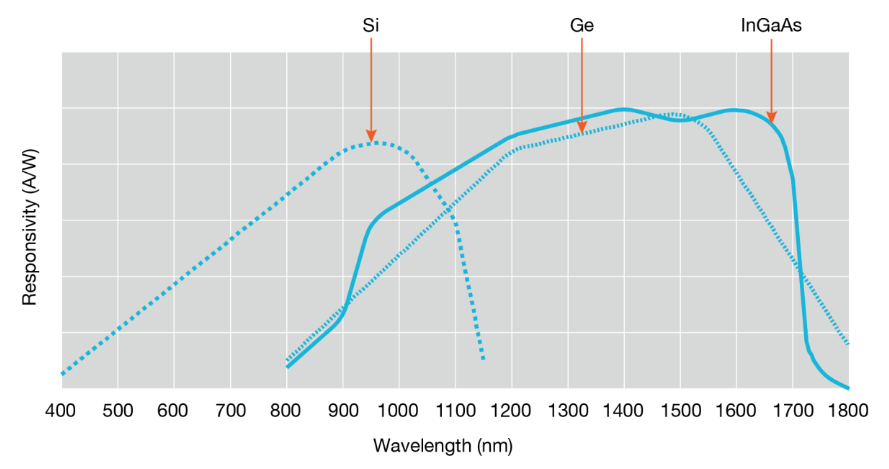
The source wavelength influences the choice of detector material and diffuse reflecting coating for the inside of the sphere. The wavelength responsivity of the detector material (Ge, InGaAs, Si) varies significantly, as shown in Figure 6.

For visible to near-IR measurements (500-1000nm), the Si detector is the best choice. Ge detectors work well with sources with wavelengths of 850 - 1450nm. InGaAs detectors respond from 850nm to 1600nm, with excellent linearity from 1400 nm to 1600nm, making them ideal for measuring optical power within that wavelength range. Refer to Table1 for additional guidance in selecting the most appropriate detector type for specific applications
Electrometers and Optical Power Meters
The majority of optical power meters consist of a low-level ammeter or electrometer combined with special features for photonics research or engineering applications. Keithley Instruments defines an electrometer as a highly refined DC multimeter that's optimized for low-level current measurements. An electrometer can be substituted for an optical power meter if the photodetector's characteristics and calibration coefficients are known.
Table 1. Detector Selector Guide.


