AC versus DC Measurement Methods for Low-power Nanotech and Other Sensitive Devices
Sensitive Measurement Needs
Researchers today must measure mate-rial and device characteristics that involve very small currents and voltages. Examples include the measurement of resistance and I-V characteristics of nanowires, nanotubes, semiconductors, metals, superconductors, and insulating materials. In many of these applications, the applied power must be kept low in order to avoid heating the device un-der test (DUT), because (1) the DUT is very small and its temperature can be raised significantly by small amounts of applied power, or (2) the DUT is being tested at temperatures near absolute zero where even a millidegree of heating is not acceptable. Even if applied power is not an issue, the measured voltage or current may be quite small due to extremely low or high resistance.
Measurement Techniques And Error Sources
The key to making accurate low power measurements is minimizing the noise. In many low power measurements, a common technique is to use a lock-in amplifier to apply a low level AC current to the DUT and measure its voltage drop. An alternative is to use a DC current reversal technique. In either case, a number of error sources must be considered and controlled.
Johnson noise places a fundamental limit on resistance measurements. In any resistance, thermal energy produces the motion of charged particles. This charge movement results in Johnson noise. It has a white noise spectrum and is determined by the temperature, resistance, and frequency bandwidth values. The formula for the voltage noise generated is:
VJohnson (rms) = √4kTRB, where:
k = Boltzmann's constant(1.38 × 10⁻²³J/K)
T = absolute temperature in K
R = DUT resistance in Ohms
B = noise bandwidth (measurementbandwidth) in Hz
Johnson noise may be reduced by:
- reducing bandwidth with digital filtering (averaging readings) or analog filtering
- reducing the temperature of the device
- reducing the source resistance
External noise sources are interferences created by motors, computer screens, or other electrical equipment. They can be controlled by shielding and filtering or by removing or turning off the noise source. Because these noise sources are often at the power line frequency, it is common practice to avoid test frequencies that are exact multiples or fractions of 60Hz (or 50Hz) when making lock-in measurements. With the DC reversal technique, the same result is achieved by integrating each measurement for an integer number of power line cycles.
Thermoelectric voltages are generated when different parts of a circuit are at different temperatures and when conductors made of dissimilar metals are joined together. Reducing thermoelectric voltages can be accomplished by keeping all connections at the same temperature and using crimped copper-to-copper connections wherever pos-sible. Given that it is rarely possible to use copper everywhere in the circuit (DUTs are rarely copper themselves), a measurement technique, such as the lock-in technique or the DC reversal method, is required to eliminate noise due to thermal effects.
Test lead resistance may also create an additive error in the resistance being measured. To prevent lead resistance from affecting measurement accuracy, the four-wire (Kelvin) measurement configuration should be used.
1/f noise is a term used to describe any noise that has increasing magnitude at lower frequencies. Noise with this characteristic can be seen in components, test circuits, and instruments. It can be caused by environmental factors, such as temperature or humidity, or by chemical processes within components, which are often given the label "aging", "burn-in", or "drift". 1/f noise can be observed as a current, voltage, temperature, or resistance fluctuation.
For this discussion we are focusing on the 1/f voltage noise in a measurement system. Material characteristics of a DUT or a test circuit component greatly influence this type of noise. For example, carbon composite resistors typically exhibit a resistance noise of 0.01% to 0.3% that has a 1/f characteristic. The noise value for metal film and wirewound resistors is about one-tenth that of composite resistors. Semiconductors fall somewhere in between these two material types.
Measurement Systems
In sensitive I-V and resistance measurements, there are two parts to the instrumentation: the current source and the voltage measurement instrument. For lock-in amplifier measurements, the researcher traditionally constructed the source, because precision AC current sources simply were not previously available. For the DC reversal method, a current source with reversible polarity is used, and the DUT response is measured with a nanovoltmeter.
Lock-in Amplifier Method. Lock-in amplifiers can measure small AC signals, some down to a few nanovolts. With this type of instrument, accurate measurements can be made even when noise sources are higher than the signal of interest. The lock-in amplifier uses a technique called phase sensitive detection to single out the signal at a specific test frequency. Noise signals at other frequencies are largely ignored. Because the lock-in amplifier only measures AC signals at or near the test frequency, the effects of thermoelectric voltages (both DC and AC) are also reduced.
Figure 1 is a simplified block diagram of a lock-in amplifier setup to measure the voltage of a DUT at low power. Current is forced through the DUT by applying a sinusoidal voltage (A sin[2π fo t]) across the series combination of RREF and the DUT. Usually, RREF is chosen to be much larger than the DUT resistance, thereby creating an approximate current source driving the DUT.
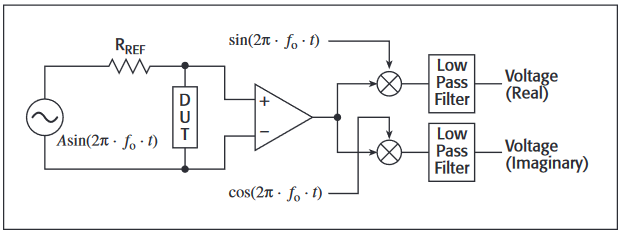
The amplified voltage from the DUT is multiplied by both a sine and a cosine wave with the same frequency and phase as the applied source and then put through a low pass filter. This multiplication and filtering can be done with analog circuits, but today they are more commonly performed digitally within the lock-in amplifier after the DUT's response signal is digitized.
The outputs of the low pass filters are the real (in phase) and imaginary (out of phase) content of the voltage at the frequency fo. DUT resistance values must be calculated separately by the researcher based on the assumed current and measured voltage levels.
Researchers using lock-in amplifiers often choose to operate the instrument at a relatively low frequency, i.e., less than 50Hz. A low frequency is chosen for many reasons. These include (1) getting far enough below the frequency roll-off of the DUT and interconnects for an accurate measurement, (2) avoiding noise at the power line frequency, and (3) getting below the frequency cutoff of in-line electromagnetic interference (EMI) filters added to keep environmental noise from reaching the DUT.
DC Reversal Measurement Method. An alternative to lock-in amplifiers uses DC polarity reversals in the applied current signal to nullify noise. This is a well-established technique for removing offsets and low frequency noise. Today's DC sources and nanovoltmeters offer significant advantages over lock-in amplifiers in reducing the impact of error sources and reduce the time required to achieve a low noise measurement.
As shown in Figure 2, one simply applies a current to the DUT and measures the DUT voltage, then reverses the current and remeasures the voltage. The difference of the two measurements divided by two is the voltage response of the DUT to the applied current level. Repeating the process and using averaging reduces the noise bandwidth and therefore the noise. These are called "Delta" measurements by some researchers.
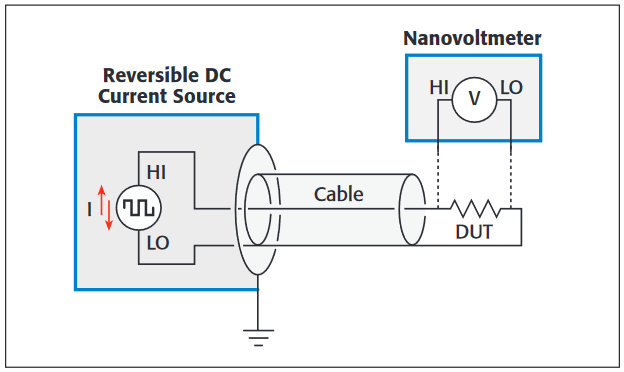
In the past, this was a manual technique with most instruments, which limited the reversal speed to less than 1Hz. Modern instruments now allow the technique to be automated and the reversal speed increased. The reversal speed sets the frequency that dominates the noise. Higher reversal speed removes low frequency noise and thermal drift better, because these noise sources have lower power at higher frequencies.
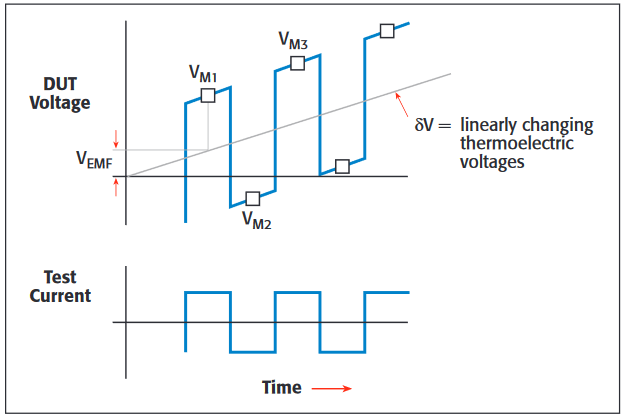
Basically, the Delta method consists of alternating the current source polarity and using a moving average of three voltage readings to calculate resistance (Figure 3). The three measurements are:
VM1 = VDUT + VEMF
VM2 = -VDUT + VEMF + δV
VM3 = VDUT + VEMF + 2δV, where VM1, VM2 and VM3 are voltage measurements
VDUT = the voltage drop of the DUT due to the applied current
VEMF = the constant thermoelectric voltage offset at the timeVM1 is taken
δV =linearly changing thermoelectric voltage
Cancellation of both the thermoelectric voltage offset (VEMF) and the thermoelectric voltage change (δV) term is possible through a mathematical computation using the three voltage measurements. First, take one-half the difference of the first two voltage measurements and call this VA:
VA = (VM1 - VM2)/2 = [(VDUT + VEMF) - (-VDUT + VEMF + δV)]/2 = VDUT - δ/2
Likewise, take one-half the difference of the second (VM2) and third (VM3) voltage measurements and call this term VB:
VB = (VM2 - VM3)/2 = [(VDUT + VEMF + 2δV) - (-VDUT + VEMF + δV)]/2 = VDUT + δV/2
Each of these results has eliminated the constant offset, VEMF, but still has errors from the drift term, δV. The average of VA and VB, however, is simply VDUT.
Vfinal = (VA + VB)/2 = (VM1 - 2VM2 + VM3)/4 = VDUT
Successive readings can then be averaged to reduce the measurement bandwidth to reach desired noise levels.
Upon examination, the preceding mathematics is really the multiplication of a string of VM readings by a sequence of weightings +1, -1, +1, etc. It is exactly analogous to the way a lock-in amplifier multiplies its acquired signals by the sine functions, which are used as the stimulus. The commercially available current source and nanovoltmeter described in the endnote of this article automate the entire procedure; resistance values are calculated and displayed by the instrumentation.
Same Technique, Improved Measurement Hardware. As we've seen, the lock-in amplifier method and DC reversal method are both AC measurements. In both methods, DC noise and the noise at higher frequencies are rejected. However, the nanovoltmeter/current source combination can provide superior measurement capabilities over the entire range of device resistances, as explained in the following paragraphs.
Measurements on Low Resistance DUTs
A typical low resistance measurement application is shown in Figure 4. Instrument voltage noise is generally the dominant error in low resistance measurements, but below a certain level of device resistance, common mode noise becomes a problem.
The four lead resistances shown in Figure 4 vary from 0.1Ω to 100Ω, depending on the experiment. They are important to note, because with low resistance devices, even the impedance of copper connection wires can become large compared to the DUT resistance. Further, in the case of many low impedance experiments carried out at low temperatures, there are often RF filters (e.g., Pi filters) in each of the four device connection leads, typically having 100Ω of resistance.
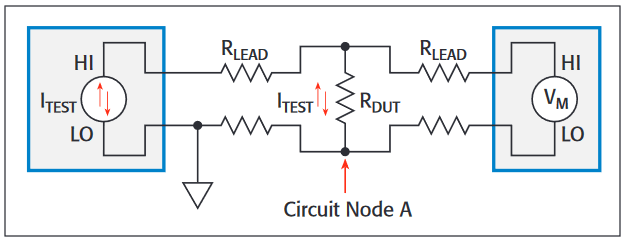
Regardless of the instruments used to carry out the AC measurements, the test current flows through the source connection leads and develops a voltage drop from the circuit ground to the connection to the DUT, denoted as Circuit Node A. Thus, the voltage at circuit node A moves up and down, with an amplitude of ITEST × RLEAD volts, while the VMEASURE input is trying to detect a much smaller AC voltage of ITEST × RDUT.
With the connections in this type of measurement circuit, common mode rejection ratio (CMRR) becomes an issue. CMRR specifies how well an instrument can reject variations in the measurement LO potential. The CMRR specification for a typical lock-in amplifier is 100dB (a factor of 105 rejection). In actual measurement practice, this is more likely to fall in the range of 85 - 90dB. By comparison, nanovoltmeters are available with CMRR specifications of 140dB. Combined with a modern current source operating in Delta Mode, it is possible to achieve a CMRR of better than 200dB in actual measurements.
To understand the impact of CMRR, consider the example described previously. With only 100dB rejection, the measurement of VDUT (which should be ITEST×RDUT) is in fact ITEST×RDUT±ITEST×RLEAD/105. Thus, there is a 1% error when RLEAD is 103×RDUT. With 100Ω lead resistance, it is impossible to make a measurement within ±1% error bounds when RDUT is less than 0.1Ω. On the other hand, a modern DC current source and nanovoltmeter, with their combined CMRR of greater than 200dB, can measure resistances as low as 1μΩ within ±1% error bounds, even with 100Ω lead resistance.
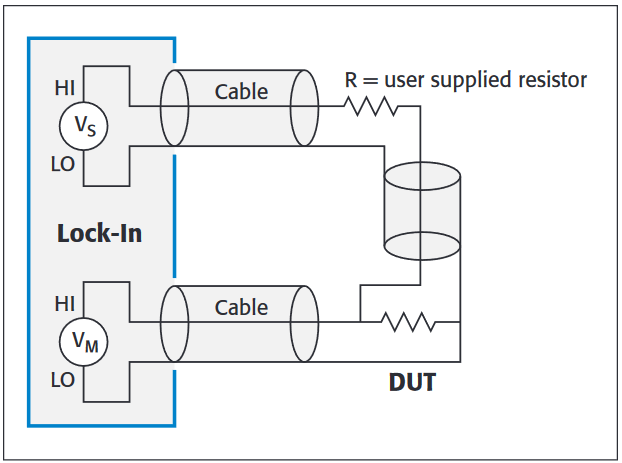
It is also worth noting that in the case of the lock-in amplifier, the current source shown in Figure 4 would likely be a homemade source constructed from the VOUTPUT and a hand-selected (and thoroughly characterized) resistor (R), as shown in Figure 5. Every time a different test current is desired, a new resistor must be characterized, inserted in the circuit, temperature stabilized, and shielded. Even with this effort, it does not deliver constant current, but instead varies as the DUT resistance varies. Now, commercial reversible DC current sources provide stable outputs that are far more predictable without manual circuit adjustments to control current magnitude.
High Resistance Measurements
Values of DUT resistance greater than 10kΩ present challenges of current noise and input loading errors. Current noise becomes visible as a measured voltage noise that scales with the DUT resistance. In both the lock-in amplifier and the DC reversal systems, current noise comes from the measurement circuit and creates additional AC and DC voltage as it flows through the DUT and/or lead resistance.
For both types of system, noise values can be of a similar magnitude. A typical value is 50pA DC with 80fA/√Hz noise for the reversible current source/nanovoltmeter combination. For a lock-in amplifier, it would be around 50pA DC with 180fA/√Hz noise. While the 50pA DC does not interfere with the AC measurements, it does add power to the DUT and must be counted in the total power applied to the DUT by the measurement system. This presents a much smaller problem for the DC reversal measurement system, because a programmable current source can easily be made to add a DC component to the sourced current to cancel out the DC current emanating from the nanovoltmeter. The lock-in amplifier does not have this capability.
The second limitation in measuring higher DUT resistances is the input impedance of the voltage measuring circuit, which causes loading errors. Consider the measurement of a DUT with 10MΩ of resistance. A typical lock-in amplifier has an input impedance of about the same magnitude - 10MΩ. This means that half of the current intended for the DUT will instead flow through the instrument input, and the measured voltage will be in error by 50%. Even with careful subtraction schemes, it is not practical to achieve ±1% accuracy when measuring a DUT with a resistance greater than 1MΩ when using a lock-in amplifier.
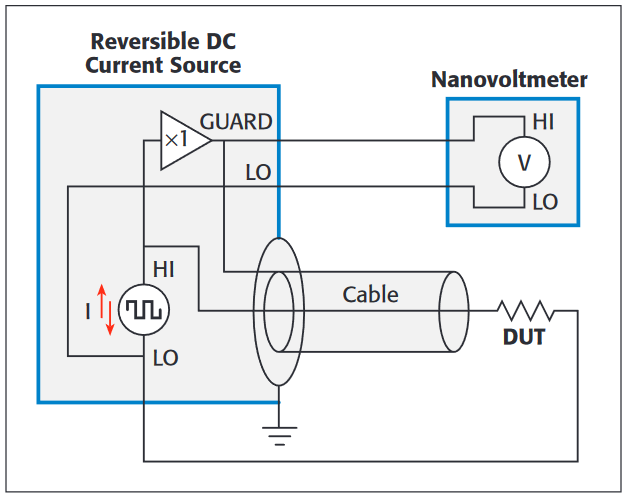
By contrast, a nanovoltmeter has 1000 times higher input impedance (i.e., 10GΩ), so it can measure up to 1GΩ with ±1% accuracy. (Subtracting the loading effect of the 10GΩ only requires knowing the input resistance to ±10% accuracy, which is readily measured by performing the DC reversal measurement using an open circuit as the "DUT.") Moreover, some current sources provides a guard amplifier, so the nanovoltmeter can measure the guard voltage instead of the DUT voltage directly (Figure 6). This reduces the current noise transmitted to the DUT down to the noise of the current source (below 20fA/√Hz). This configuration reduces the loading error, noise, and power in situations where the lead resistance is negligible and a two-wire connection to the DUT is acceptable.
Mid-range Resistance Measurements
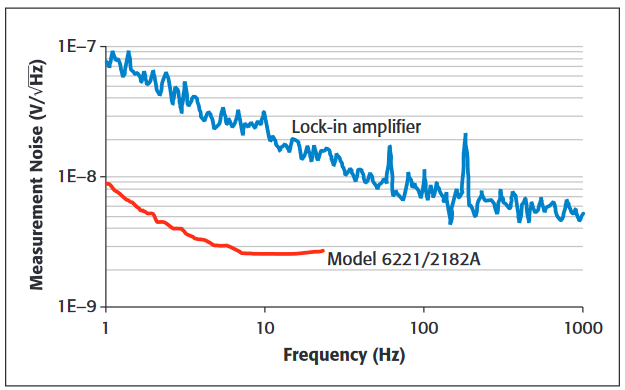
Traditionally, lock-in amplifiers have been used for measurements in the range of 100mΩ to 1MΩ due to the significant limitations outside this range. Even when RDUT falls in this range, using the DC reversal method with newer instruments may provide an advantage. For example, a lock-in amplifier has two times (or higher) white noise than a modern DC reversal system, and its 1/f voltage noise is ten times higher. (See Figure 7.) For example, when working at 13Hz (a typical frequency in lock-in measurements), a typical DC reversal system has about seven times lower voltage noise than a lock-in amplifier. This leads to 50 times less required power.
Individual Instrument Noise Comparisons
All electronic circuits generate both white noise and 1/f noise. The noise of low frequency measurements are often dominated by the latter. A lock-in amplifier's front end is usually the dominant source of 1/f noise. Instruments used in the DC reversal method have similar issues. Therefore, comparing the noise performance of a lock-in amplifier with an instrument using the DC reversal method is essentially a case of comparing the noise performance of their front-end circuitry. Furthermore, the DUT resistance value must be considered when making these comparisons.
It is common for manufacturers to specify their white noise performance, but less common to be given a 1/f noise specification. To make a valid comparison, like the one in Figure 7, the noise level should be determined as measurements are made. Another important consideration is whether to use the system voltage noise or current noise. Figure 8 shows a model of a measurement system with Vn being the voltage noise of the system, In being the current noise, and IS being the source current.

A signal-to-noise ratio of one (one possible measurement objective) is achieved when the power forced on the DUT equals the noise power of the system. This is expressed by:
PDUT = I2S·RDUT = V2n/RDUT + I2n·RDUT
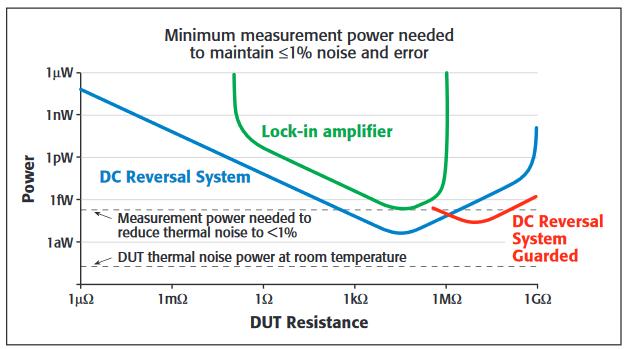
This equation describes the V-shaped curves in Figure 9. Voltage noise dominates when the DUT resistance is low, and current noise dominates when the DUT resistance is high. The required power is minimum when RDUT equals Vn/In. Ultimately, a major determinant of instrument performance is how little power can be imposed on the DUT and still get a good measurement. Nevertheless, it is important to remember that very low and very high values of RDUT impose different types of instrument limitations on these measurements compared to midrange values.
Noise, Applied Power, and Measurement Time Considerations
To put noise error into perspective, consider measurements with a desired signal-to-noise ratio of 100. Figure 9 shows the applied measurement power required on DUTs of various resistances in order to achieve a voltage response equal to 100 times the measurement system's RMS noise for a one-half second measurement time. The curves shown are for measurement setups using a lock-in amplifier and a DC reversal system. For the lock-in amplifier, it illustrates the relatively small range of measurable resistances and the need for greater applied power to overcome the higher noise levels. The noise of the DUT is shown separately, because it is dependent on temperature. However, the Johnson noise power for room temperature resistances is represented by the lower horizontal dashed line in Figure 9.
It can be shown that noise power (VJohnson2/R) in the DUT measurement is a function of temperature and is not dependent on its resistance. Measuring a DUT with 1% RMS noise requires a signal voltage 100 times the noise voltage, thus a signal power 1002 or 10,000 times the noise power, as shown by the upper dashed line in Figure 9. (See endnote for a description of the instruments used to collect the data.)
Depending on which is greater, the system noise or the DUT noise should be used to determine the applied power required, which in most measurements should be as low as possible. Increasing the measurement time decreases the required power by the same factor as the increase in time. For example, if time is increased by a factor of four (e.g., from ½ second to two seconds), then the required power decreases by a factor of four.
For the current source and nanovoltmeter combination, Figure 9 shows that the system noise is less than the Johnson noise of room temperature DUTs between 500Ω and 100MΩ. Physics present the only limitation on this DC reversal system, and low temperature measurements will benefit from the full capabilities of the system to make measurements with even less power.
Summary
Lock-in amplifiers are useful for many measurement applications. Still, their common mode rejection ratio and low input impedance limits low power resistance measurements to a range of about 100mΩ to 1MΩ. Typically, they are employed with user constructed current sources, which are difficult to control with variable loads, resulting in poor source accuracy. Results are obtained as current and voltage readings, requiring the researcher to calculate resistance.
With modern current sources and nanovoltmeters, the DC reversal method requires less power while providing excellent low-noise results. This combination is optimal for low frequencies (0.1 - 24Hz), allowing measurements to be made much faster than with a lock-in amplifier. At resistances less than 100mΩ, they have much better rejection of lead resistances, and, at resistances greater than 1MΩ, they have much higher input impedance and less associated loading error.
The greatest advantage comes from current sources and nanovoltmeters that have been designed to work together in Delta Mode, and provide resistance values read directly from the instrument display. These instruments are connected by a communication path that synchronizes them, allowing current reversal frequencies up to about 24Hz. Working as a system, they effectively cancel thermoelectric offsets that drift over time and avoid errors associated with common mode rejection problems that are prevalsent in low impedance measurements. By following good test practices, these instruments provide excellent measurement accuracy from 10nΩ to 1GΩ. The measurement noise level for such a system is about 3nV/√Hz at 5Hz and higher frequencies.
Endnote
In Figures 7 and 9, a lock-in amplifier similar to the SR-830 was used to collect data for comparison with the DC reversal method, the latter using a combination of the Keithley Model 6221 AC and DC Current Source and Model 2182A Nanovoltmeter.

