
Keithley's Touchscreen User Interface
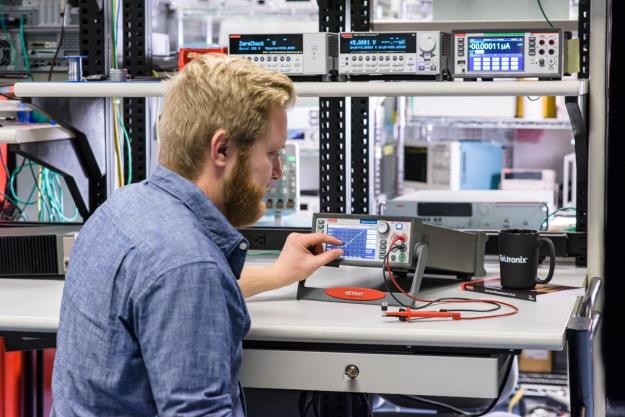
Keithley’s Touch, Test, Invent® touchscreen products feature the same look and feel thanks to their UI, referred to as the TTI interface. This custom interface, developed by Keithley engineers, makes it incredibly simple to use the instruments and analyze data right in the box. The TTI interface can be found with Keithley’s Source Measure Units (SMUs), some Digital Multimeters (DMMs), and Data Acquisition Units (DAQs). So, apart from a few customizations and minor differences, the interface and its features are similar across instruments.
In this article, we will explore the TTI interface, looking at its features and capabilities in detail.
The Home Page
The Home Page of TTI instrument prominently displays your current measurement at the top, and tabs at the bottom that you can swipe through. You can also activate the large unit display feature that displays your measurements in large font on the screen, useful if you only want to see the measurement from, say, across the room, and are not interested in any of the other tabs on the interface.
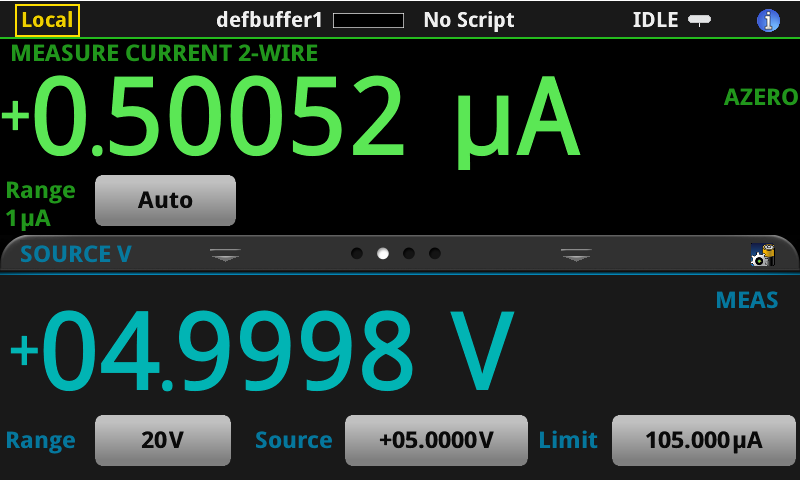
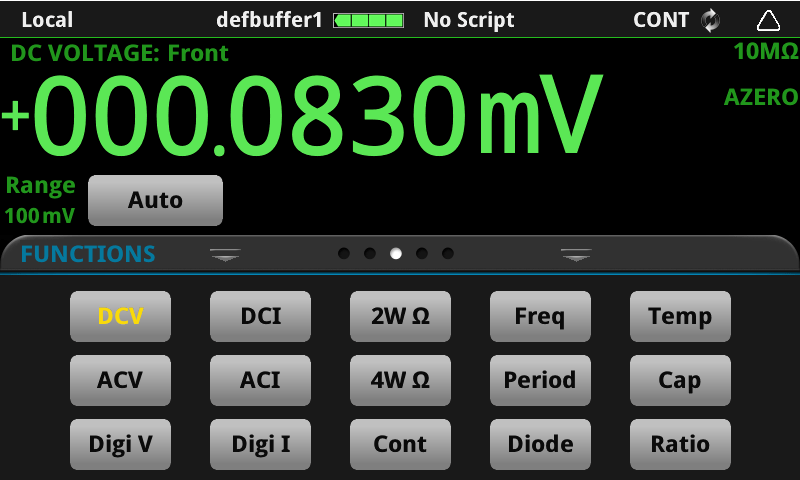
There are different tabs at the bottom of the home screen. Depending on your instrument, the exact tabs will vary, but they all offer quick access to often-needed settings and displays. All instruments have a Settings tab with common settings for your selected function, and a Graph tab that allows you to look at a live trend plot of your measurement.
The Menu
The Menu is accessible via a soft key to the left of the touchscreen display. Every setting for the instrument is accessible from this Menu with just one touch into the interface. So, for example, to see or change all the settings related to your measurement, you only need to click into the singular ‘measure settings’ view. This will give you access to all the measure settings that are applicable to the function you’re on. So, you don’t have to cycle through all the different menus or go through a hierarchical menu tree as everything is directly accessible at the first level itself.


Viewing and Analyzing Data
Now, let’s look at some of the ways to view and analyze data on the TTI interface. All TTI instruments have at least three views:
Reading table
This offers a tabular view of all the actual data, with some additional, interesting features. For example, a mini graph at the top of the screen shows an overview of your entire buffer. From here, you can quickly jump to an area of interest within the buffer. Another feature is that if you do a test that has a specific number of readings (say 1000) and you’re interested in a particular reading (say 546th), you can jump straight to that specific reading index through a ‘hamburger’ menu on the screen. You can also click on any of the tables, rows, or columns to get all the measurement information stored with that reading, like the state of any limits, or source settings if you’re using a Source Measure Unit.

Histogram
This allows you to do some basic statistical analysis. You can add different buffers and adjust the number of bins in the histogram. There’s a hamburger menu here as well, just like in the reading table, which can be used to edit a watch list of channels which enables you to only look at specific channels when you’re making multi-channel measurements.

Graph
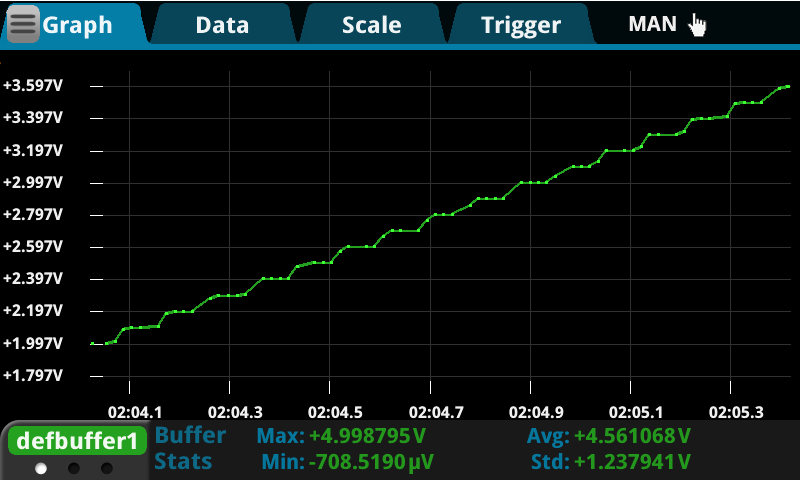
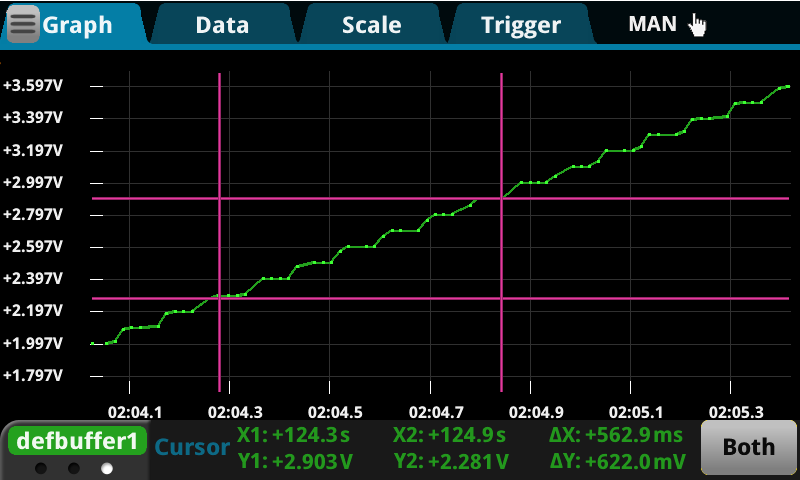
This is the best way to analyze data on the instrument. In addition to displaying basic stats right on the screen, it has several capabilities that make it very easy to use and highly functional, enabling you to do significant analysis without requiring additional computer programs. Some of the capabilities are as follows:
- You can put vertical, horizontal, or both cursors on your graph, which enables you to look at Delta X and Delta Y (the change between different measurements).
- A swipe screen at the bottom shows you some more information on your graphed data like the divisions between lines, similar to how oscilloscope divisions are read. You can also pinch and zoom to change the division ratioses and number of divisions here.
- On the data tab for the graph, you can also add different traces and plot and analyze multiple buffers at the same time.
- The graph function also allows for different scaling options. If you use SmartScale, the instrument will intelligently determine whether to show you the entire buffer or just the most recent collection of measurements. Independent Autoscaling (where each buffer has its own scale), Swim Lanes (where different buffers are stacked on top of each other), and Shared Autoscaling (where all buffers are presented on the same axis) are useful when you plot multiple buffers at the same time.
Scripting
The TTI interface also allows you to run and even create scripts and transfer them to a USB drive. A nifty feature here is the Save Setup feature. This allows you to save the current setup for the instrument in the form of a script that captures all the settings that the instrument is configured for. Then, you can use that script to either bring those settings back on that same instrument or transfer it to a different instrument through a USB drive. With more complicated setups, you can use the record functionality. This captures your entire process as you set up individual aspects of your unit and records them into a script.
TriggerFlow® Trigger Model
The trigger model of TTI instruments is represented through a graphical display called TriggerFlow. The trigger model is the best way to get the maximum speed from your instrument as it operates at a lower level than the rest of the operating system. TriggerFlow lets you configure complex trigger models by simply configuring blocks that the instrument flows through. Some of the basic templates are included, like a simple loop, duration loop, loop until event, and more. While the trigger model is running, the TriggerFlow view also shows you which block the instrument is on at the moment, very useful for debugging or following along.

Remote Access & the Virtual Front Panel
All TTI instruments feature a robust web interface that offers you a number of capabilities. First, you must connect your instrument to a LAN network. Then use your web browser to navigate to the IP address of your instrument. Once you’re connected, you’ll see several tabs on the virtual interface. From here, you can get firmware and identifying information about your instrument, send and receive commands, and even download buffers as CSV files. Another tab offers the virtual front panel.

The virtual front panel is common to all the TTI instruments. This panel is a virtual representation of the entire instrument including the full display. From here, you can control the instrument just as if it was in front of you. This is very useful when you need to change some settings from the other side of a lab or even the other side of an ocean! You can also right click from this remove interface to save a screen capture of your instrument to your PC for use in reports or troubleshooting.
In summary, this was a short overview of the Keithley Touch, Test, Invent User Interface. It touched upon some of the main features of the interface, including its virtual front panel, trigger functionality, scripting, and analyzing and viewing data on the interface. Learn more about the Keithley touchscreen interface.


